4.3 Result display
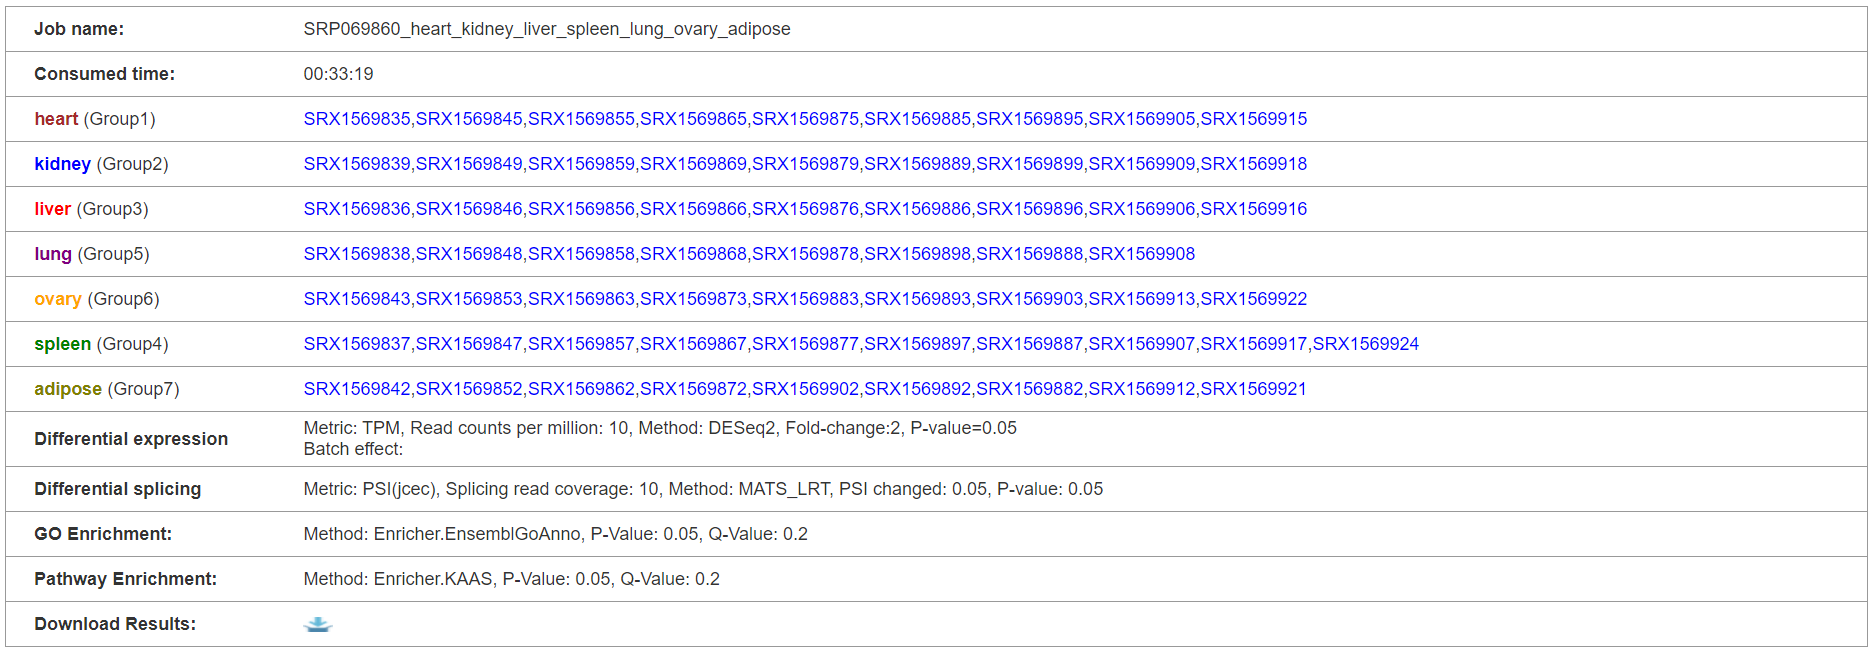
4.3.1 Parameter setting
The first section shows the groups and relative parameters set by users when submit an analysis task. The analysis result files can be downloaded here.
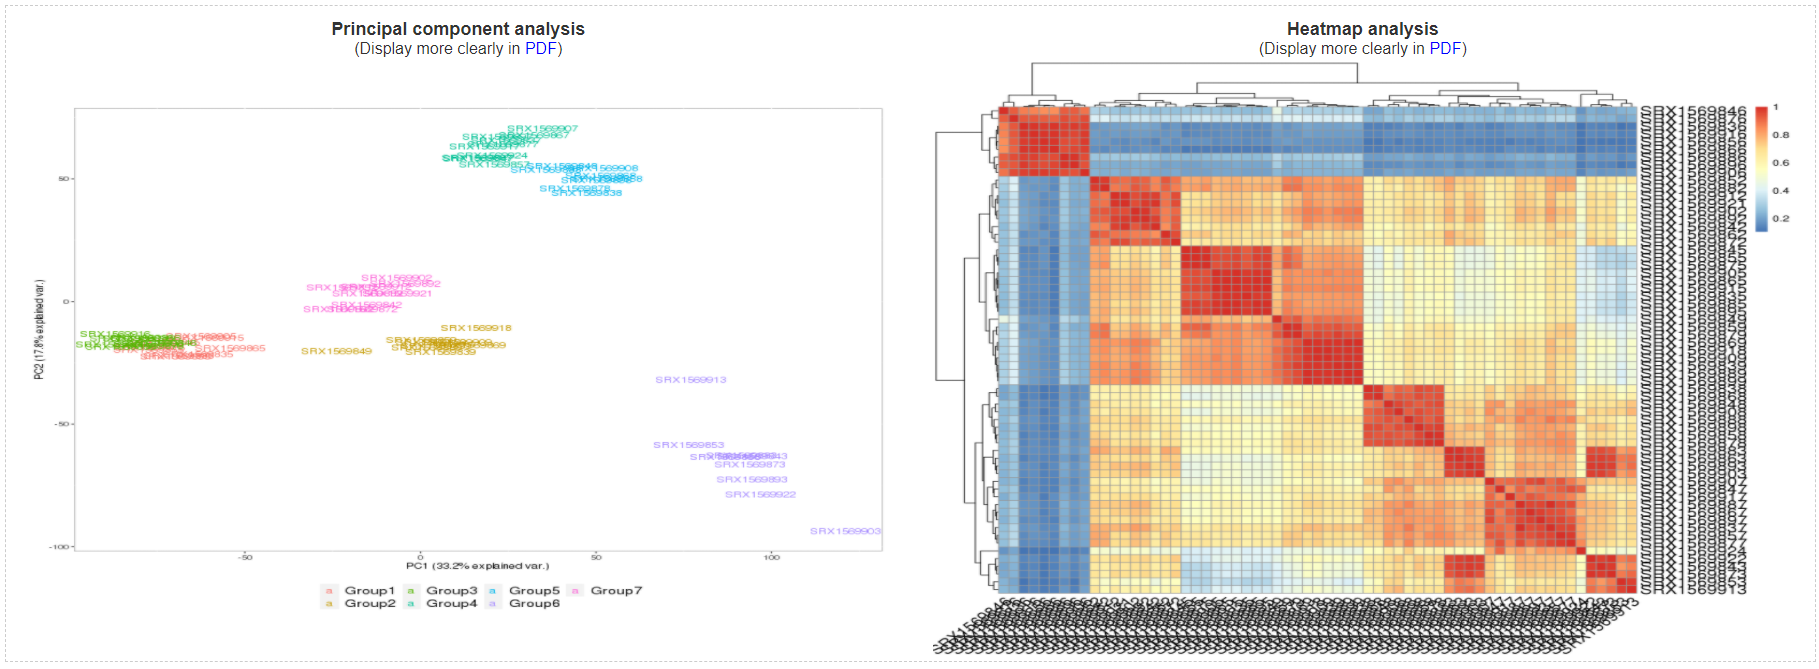
4.3.2 Sample cluster based on expression profiles
This section include two graphics from principal component analysis and heatmap analysis. By the two cluster graphics, users can learn the general affection on gene expression profiles from different experimental conditions.
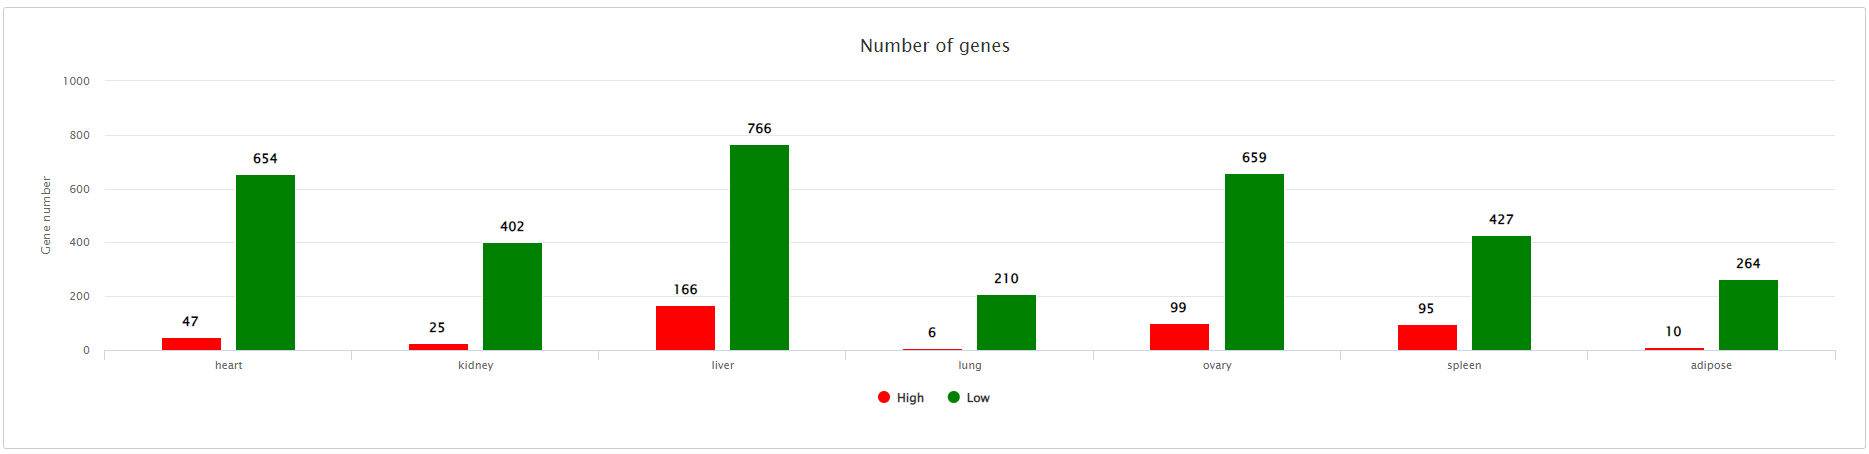
4.3.3 Summary of specifically expressed genes
A column graphics is used to summarize the numbers of specifically expressed genes.
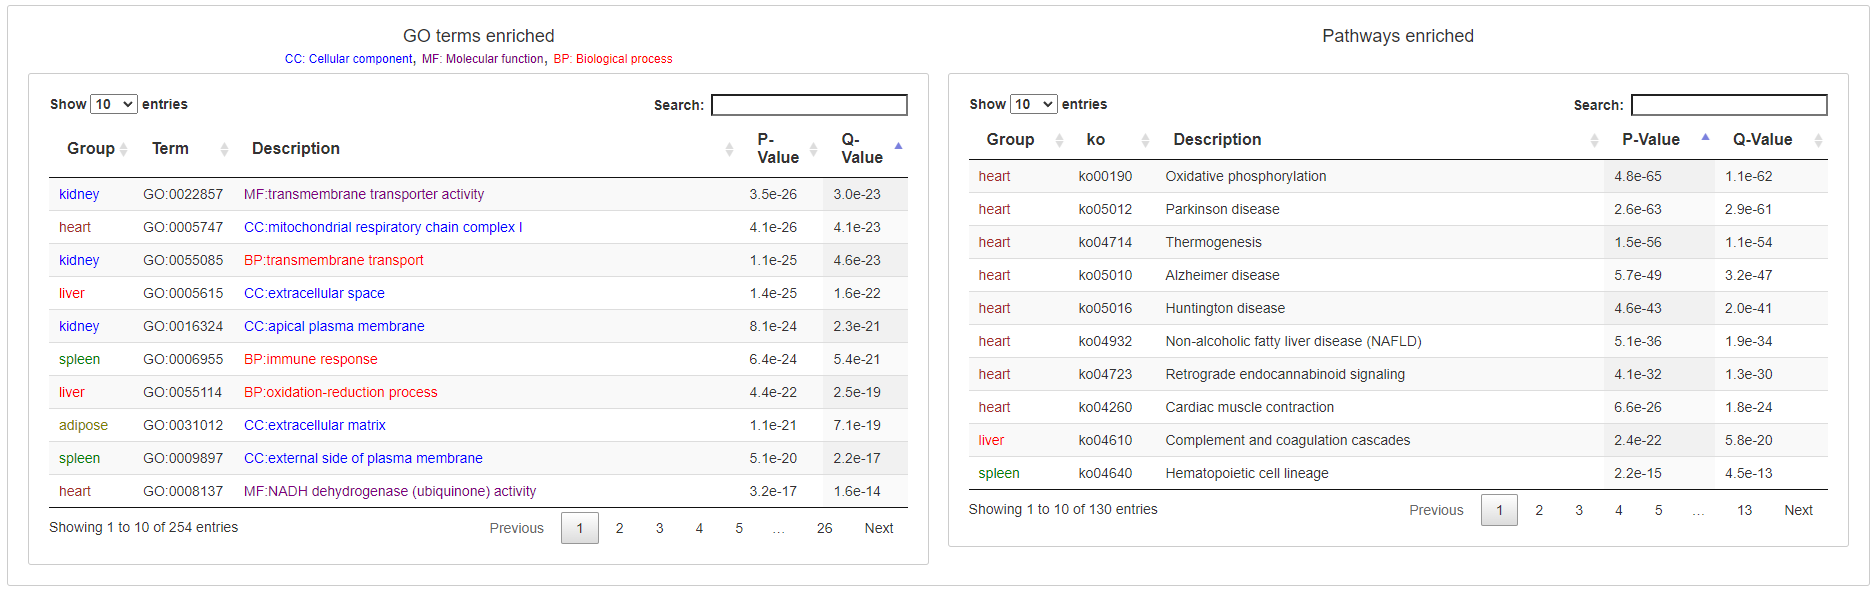
4.3.4 List of enriched GO and KEGG pathway terms on specifically expressed genes
Two tables are used to show enriched GO and KEGG pathway terms on specifically expressed genes.
4.3.5 List of specifically expressed genes
The specifically expressed genes are listed in an interactive table. Click the "specificity" link to open gene page showing the gene expression level in each sample.
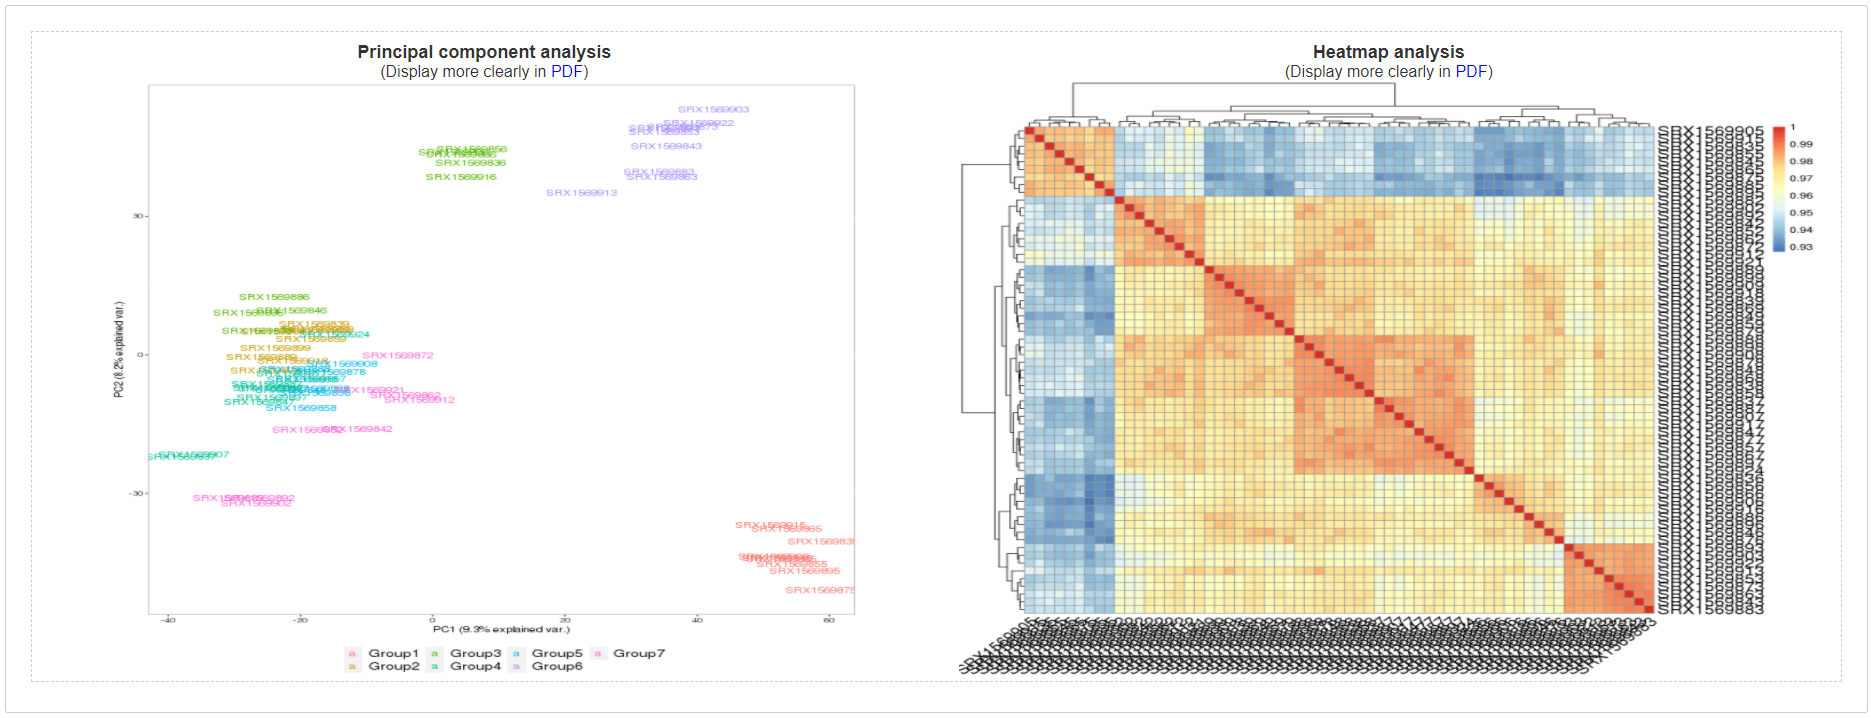
4.3.6 Sample cluster based on alternative splicing profiles
This section include two graphics from principal component analysis and heatmap analysis based on alternative splicing profiles. By the two cluster graphics, users can learn the general affection on gene alternative splicing from different experimental conditions.
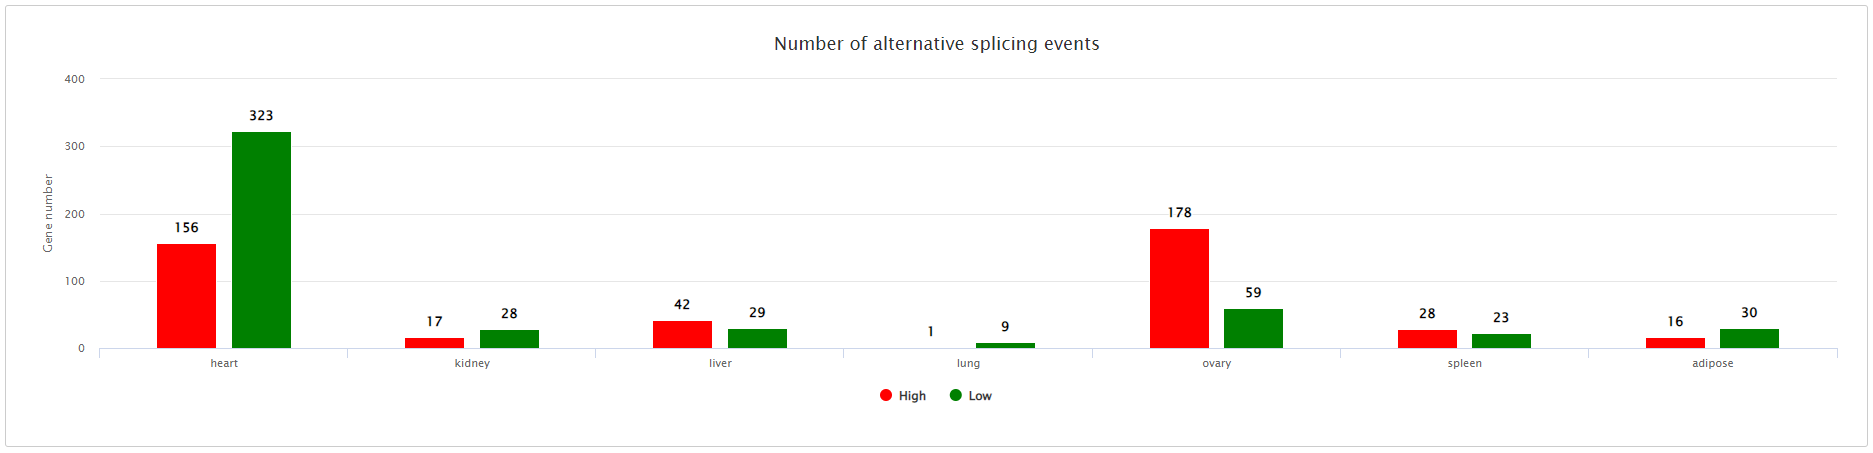
4.3.7 Summary of specifically alternative splicing events
A column graphics is used to summarize the numbers of specifically alternative splicing events.
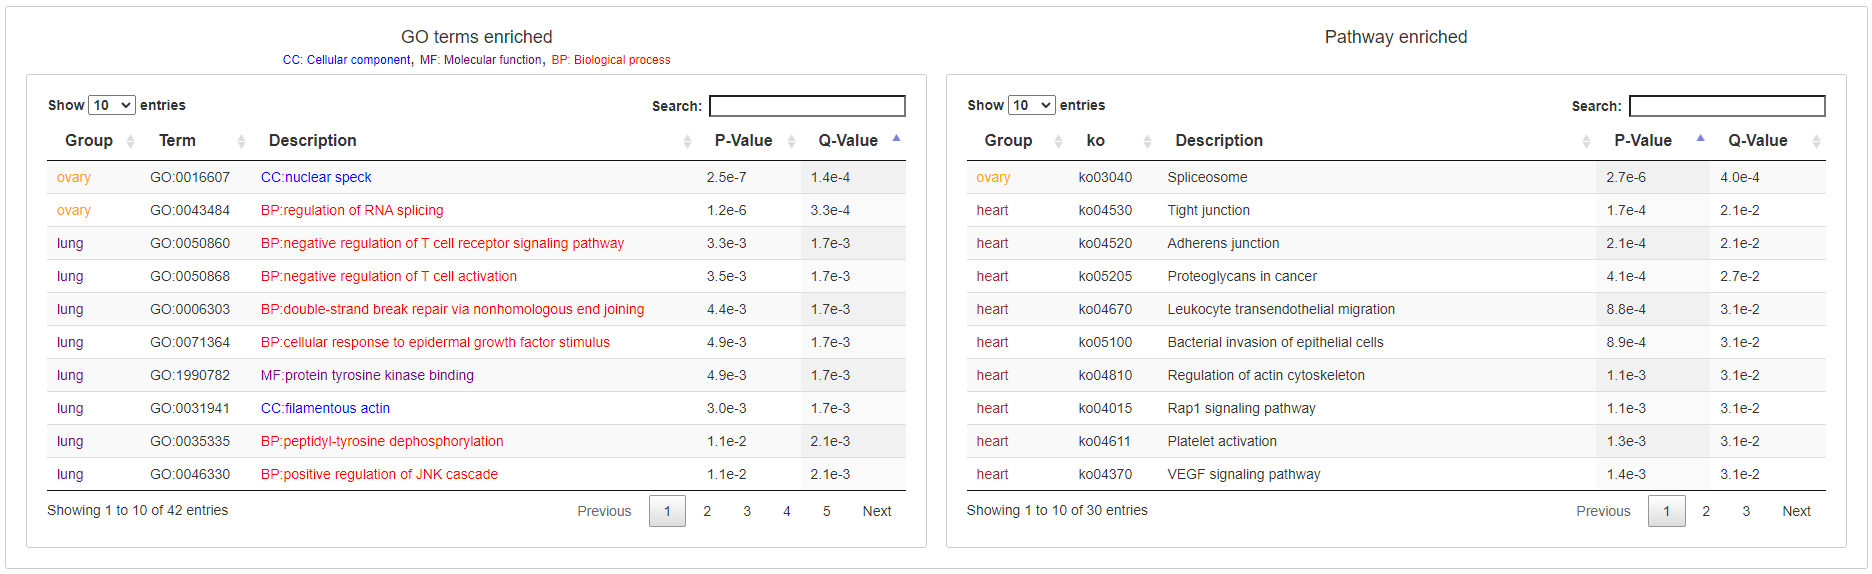
4.3.8 List of enriched GO and KEGG pathway terms on specifically spliced genes
Two tables are used to show enriched GO and KEGG pathway terms on specifically alternative splicing events.
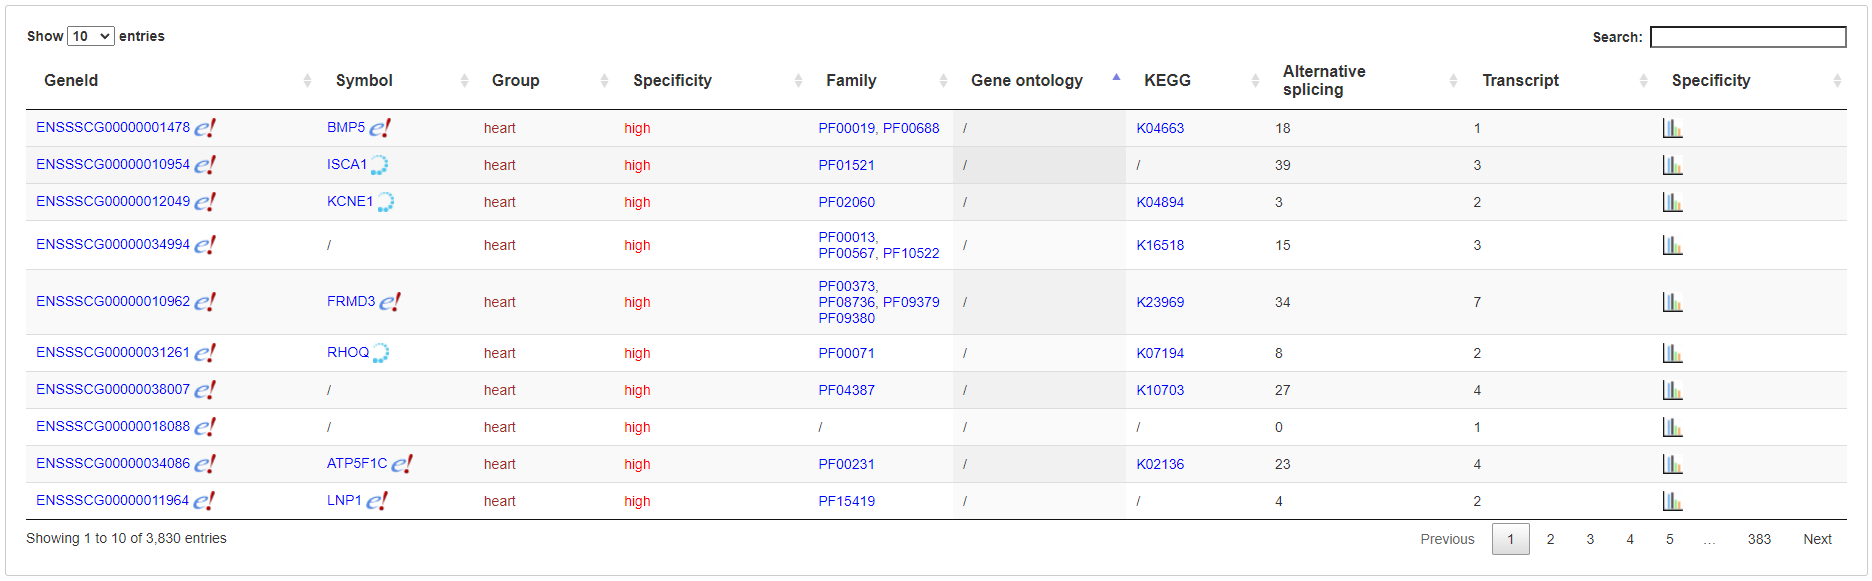
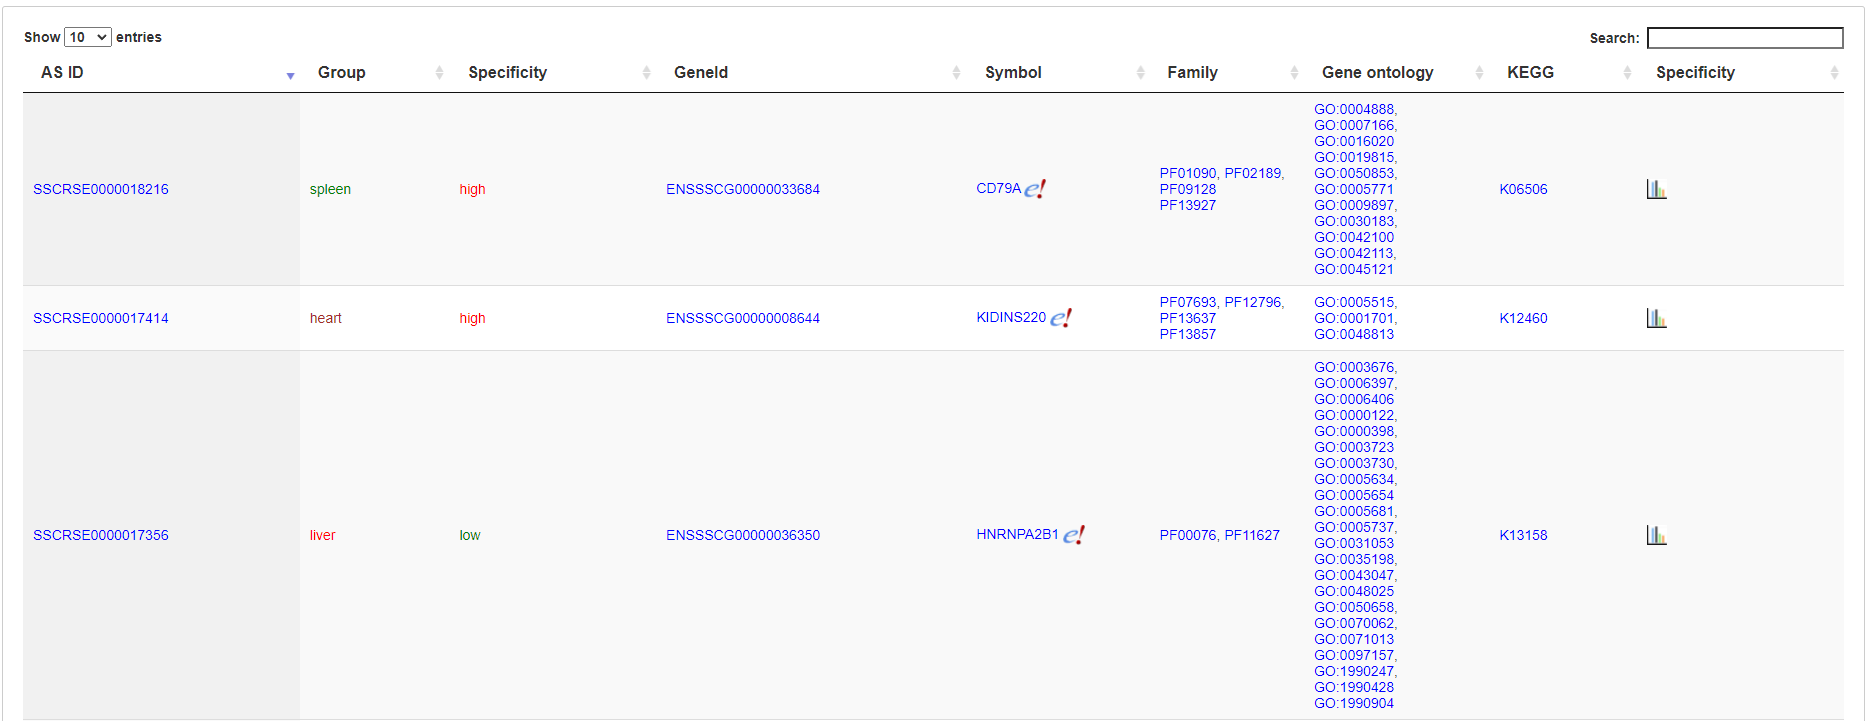
4.3.9 List of specifically alternative splicing events
The specifically spliced genes are listed in an interactive table. Click the "specificity" link to open alternative splicing page showing the alternative splicing profiles in each sample.