2.2 Result display
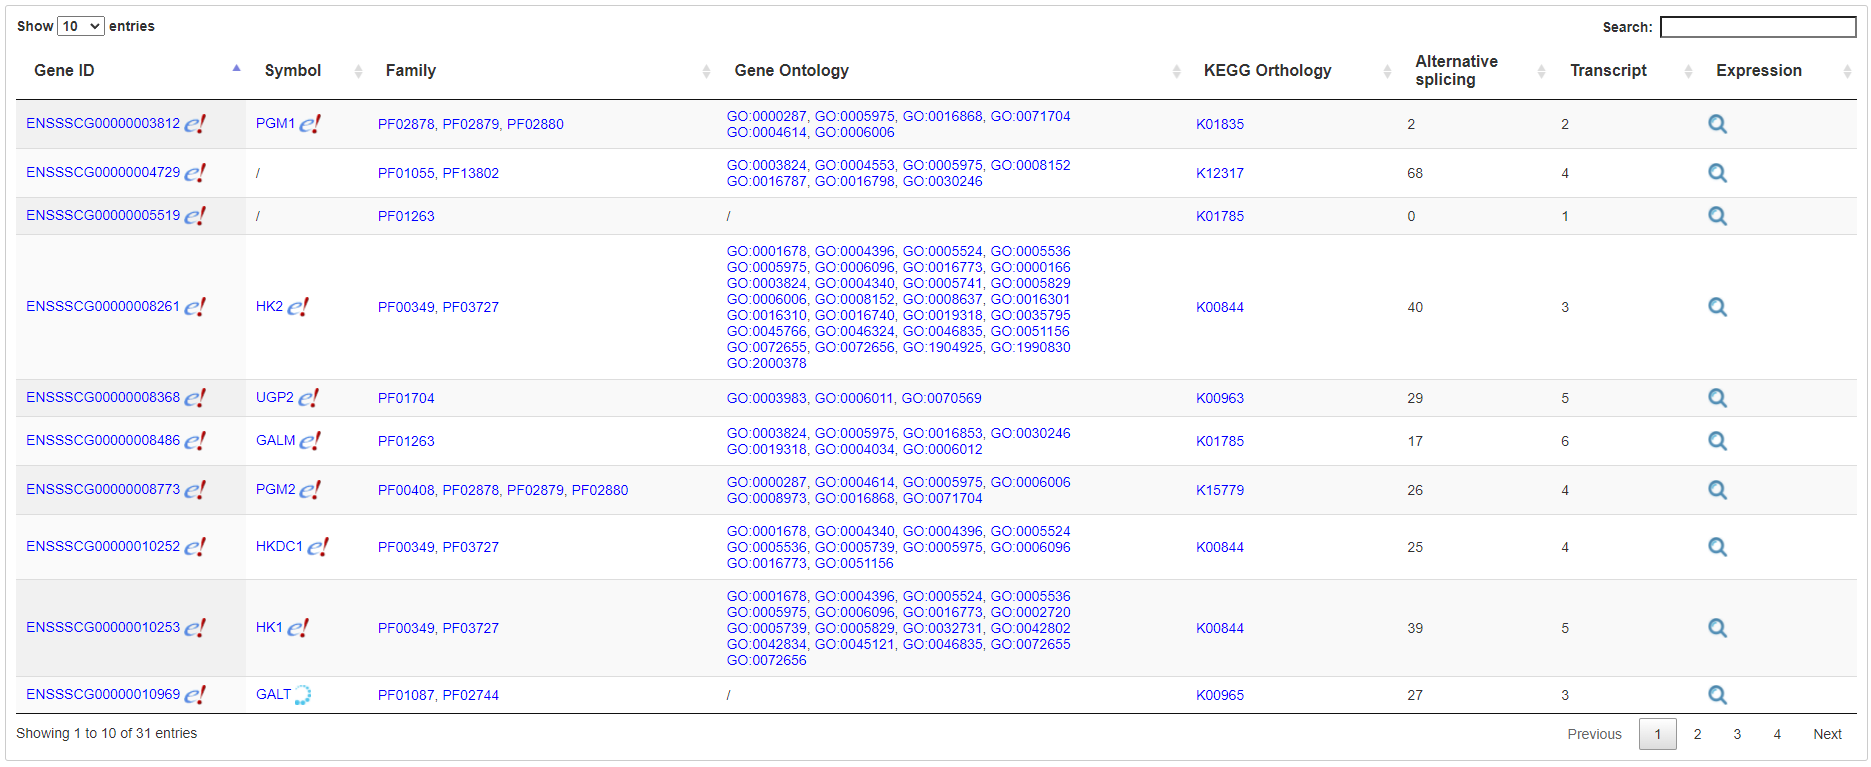
The search result is displayed in a concise interactive table containing basic information for the genes with links to new pages to further expand gene expression information.
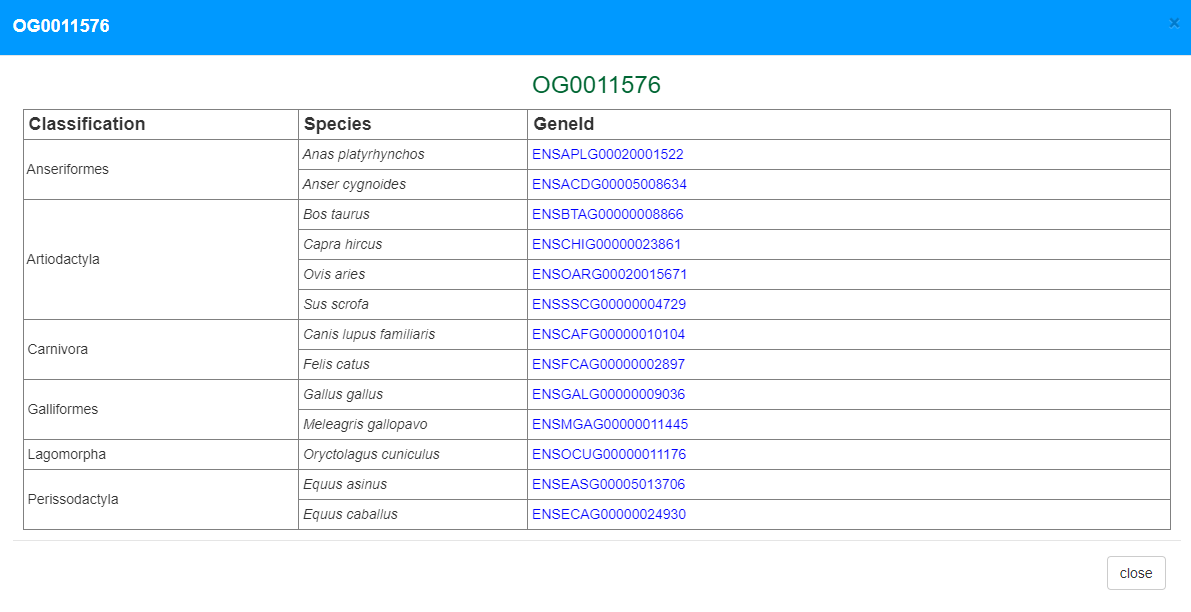
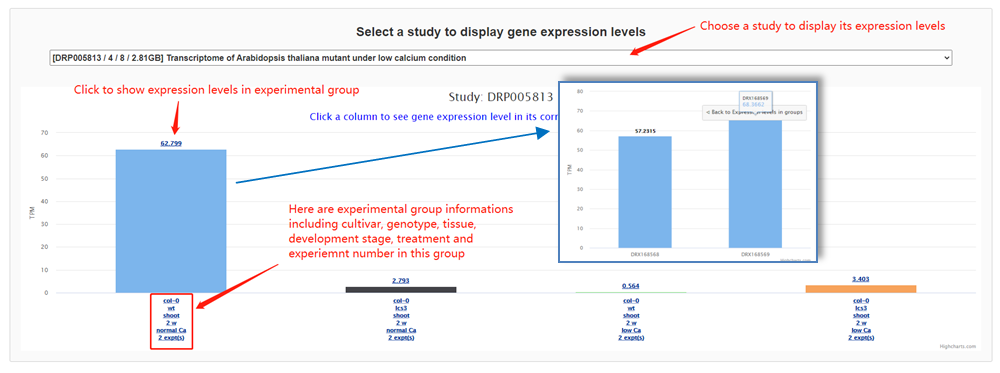
The gene expression page contains several sections. First, basic information of the gene is listed at the top of the page, including genome position, gene symbol, orthology and various function annotation such as Pfam, GO and KEGG pathways, all with links to external databases. Notably, users can open a popup page to explore orthologous gene expression in other species, an important feature that is uncommon in other databases. Second, a genome browser was implemented to allow users to explore the gene, transcripts and alternative splicing in its genomic context Third, a functional structure graph is displayed to illustrate positions of Pfam domains. Fourth, gene expression or alternative splicing across samples were displayed by a hierarchical and interactive bar chart. Each bar represents an experimental group in the bar chart and can be further expanded to show the diversity of expression among the same treatment group.
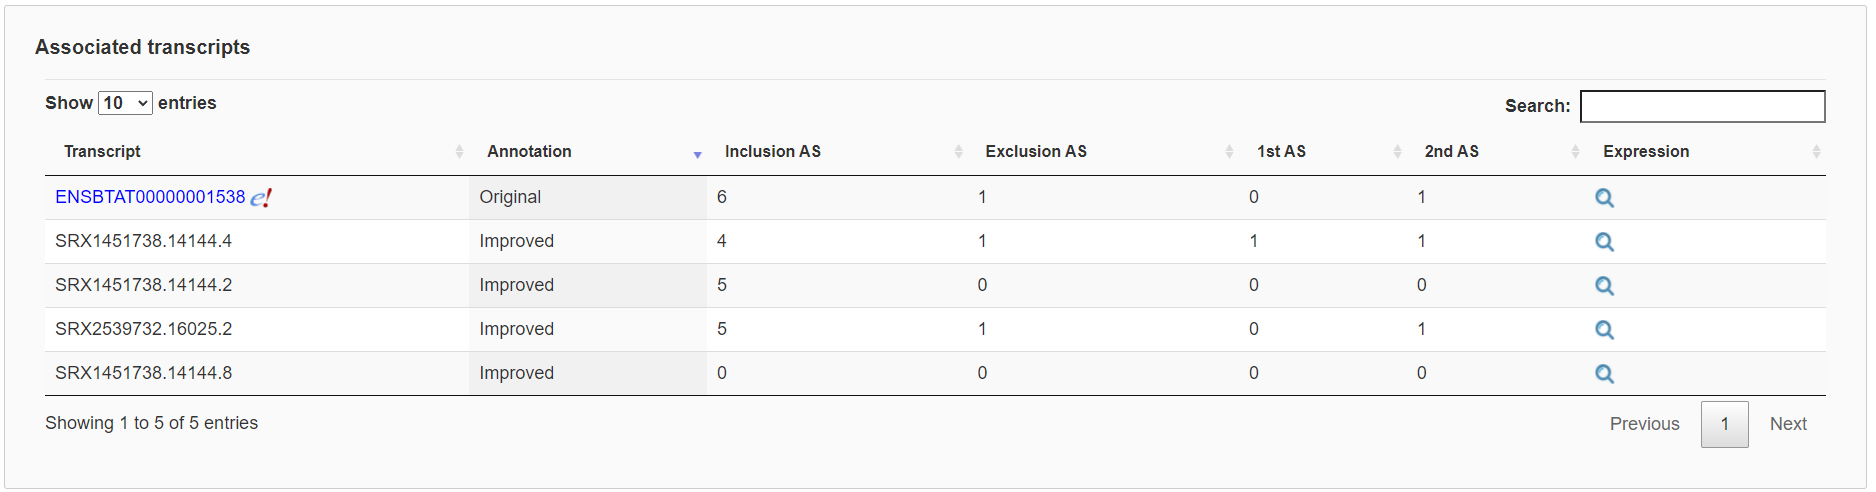
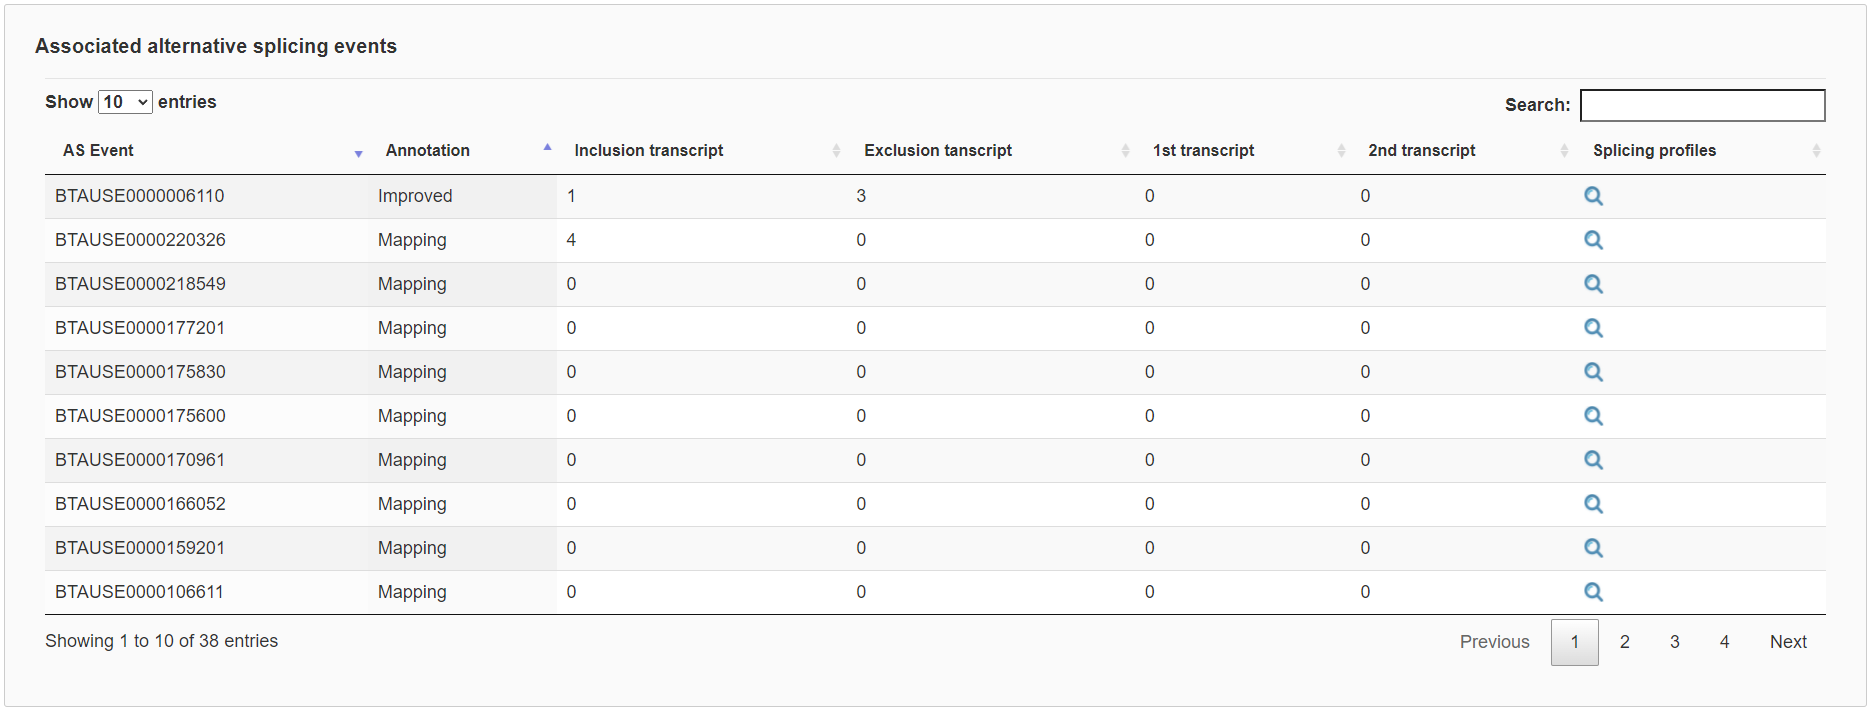
Finally, each gene expression page contains two tables respectively to list associated transcripts and alternative splicing events with links to show further details. Importantly, the impact of alternative splicing events can be visualized with their relative positions to protein domains.