6.3 Result display
6.3.1 Parameter setting
The first section shows the parameters and groups set by users when submit an analysis task.
6.3.2 ortholog group table
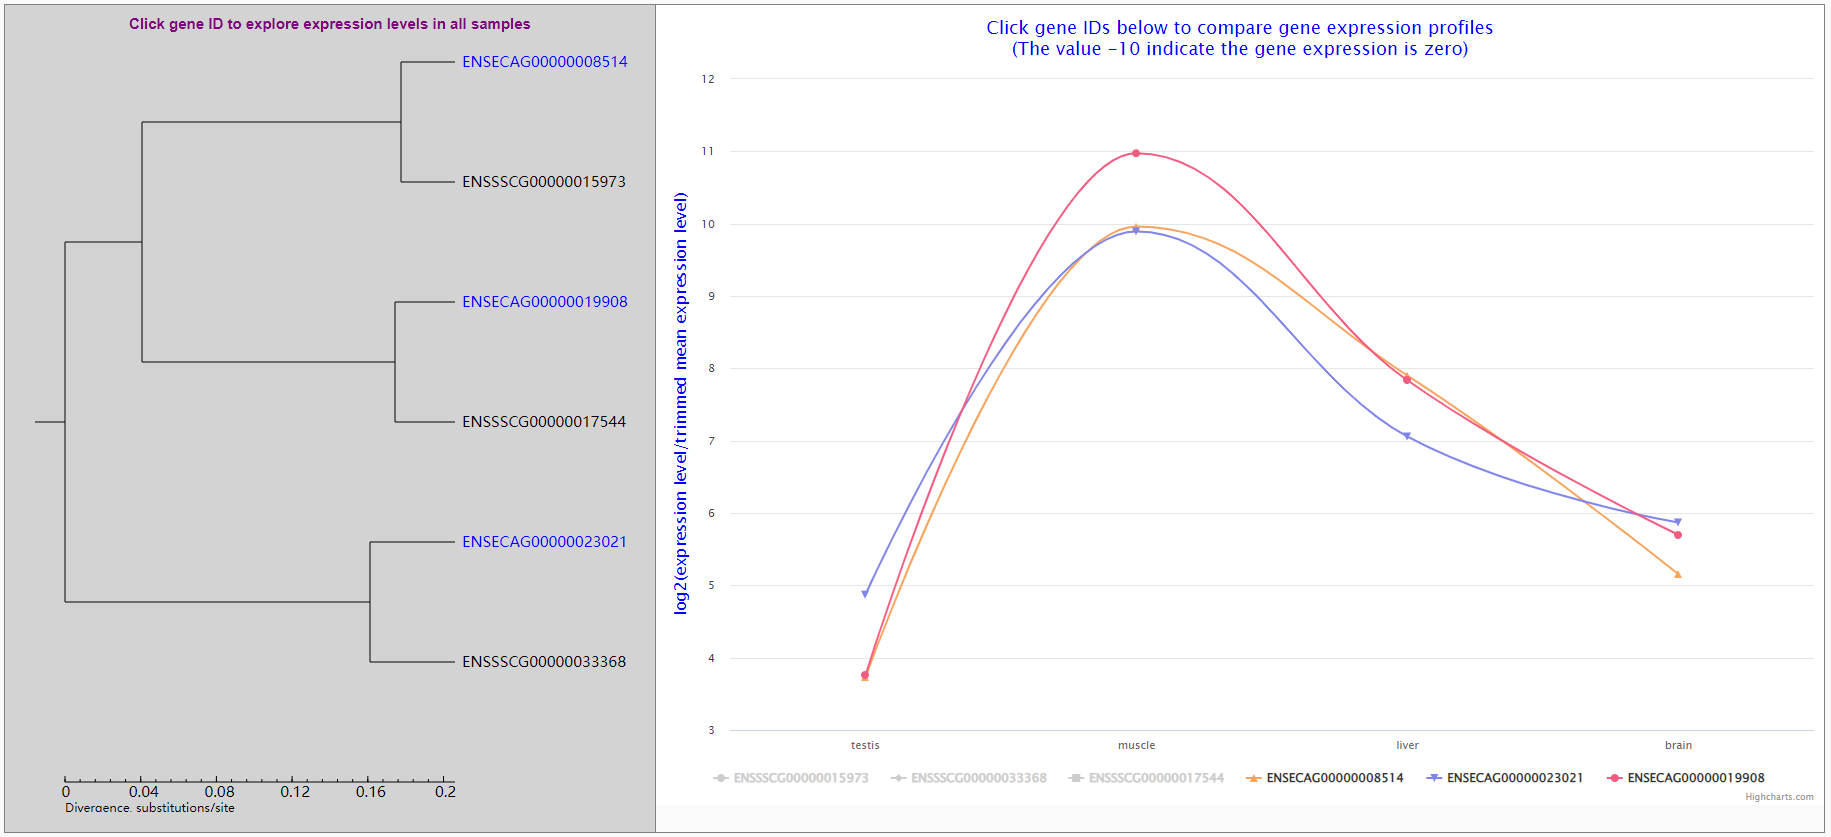
Ortholog groups with expression correlation coefficients are listed in a table with links to open new page showing expression profiles and phylogenetic tree of ortholog genes.
In the new open page, users can learn the molecular phylogenetic tree of ortholog genes and select some genes to compare their expression profiles. Gene expression values are log2 transformed ratios of gene expression in a sample divided by trimmed mean expression level.
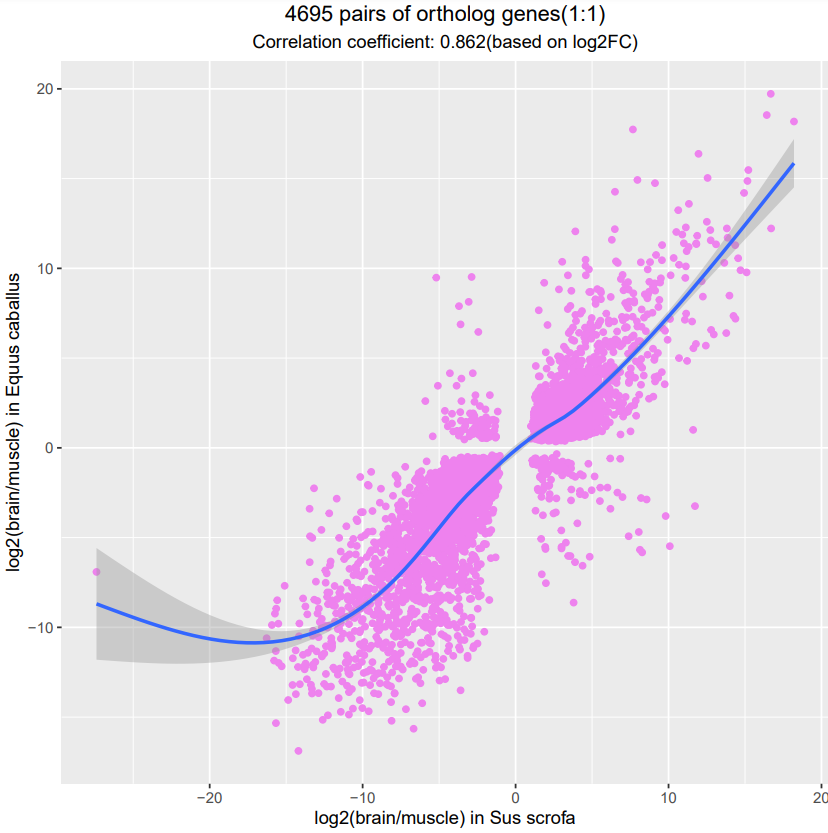
6.3.3 Scatter plot of expression ratios of differentially expressed 1:1 ortholog gene pairs in comparison
To intuitively learn cross-specie sexpression consistence, the expression ratios of differentially expressed 1:1 orthlog gene pairs are ploted in a two-dimensional coordinate plane and the overall expression correlation coefficients of ortholog gene pairs is also calculated.
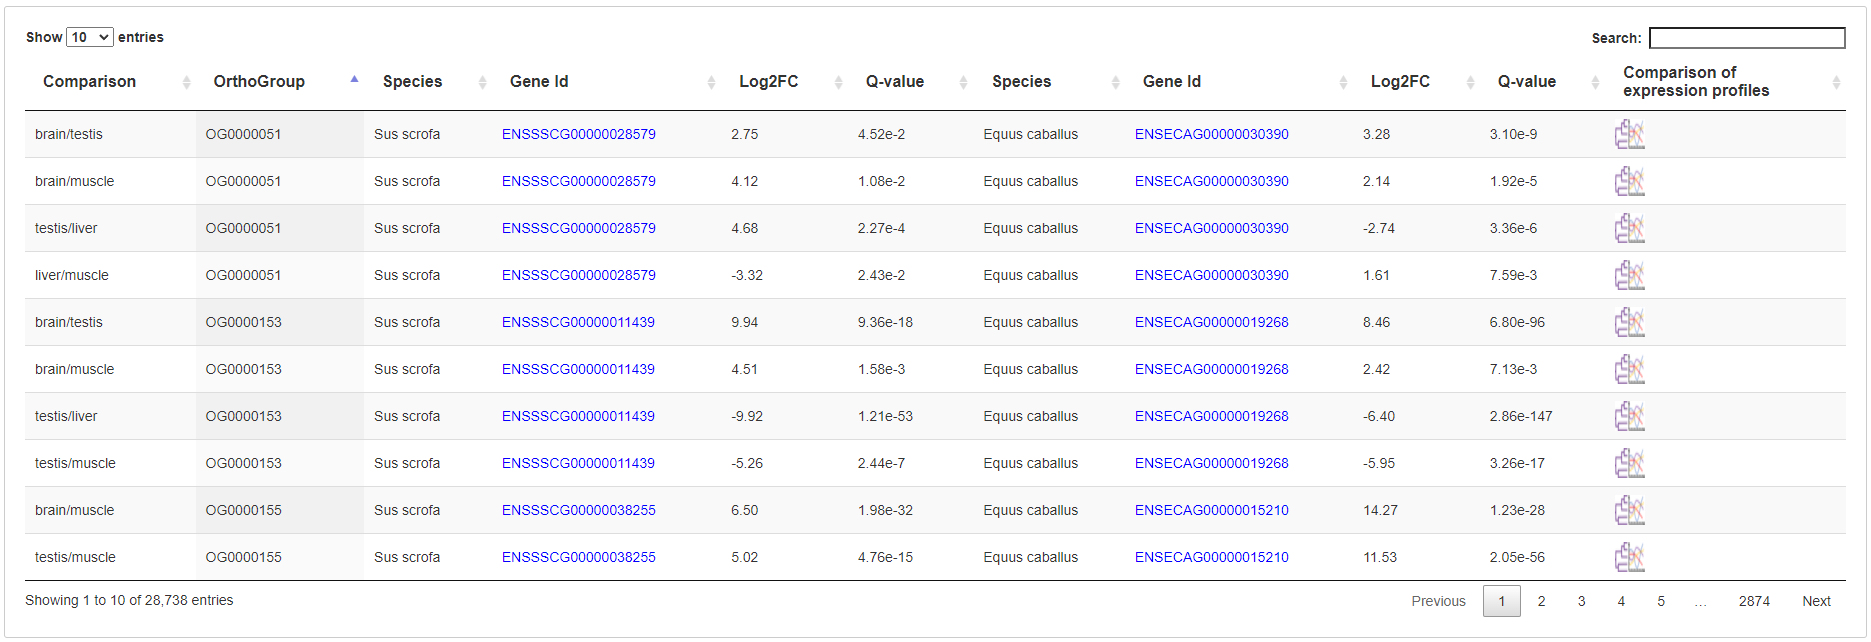
6.3.4 A table of differentially expressed ortholog genes
All differentially expressed in all two-group comparison are listed in a table with links to open new page to compare their expression profiles in all groups.


