5.3 Result display
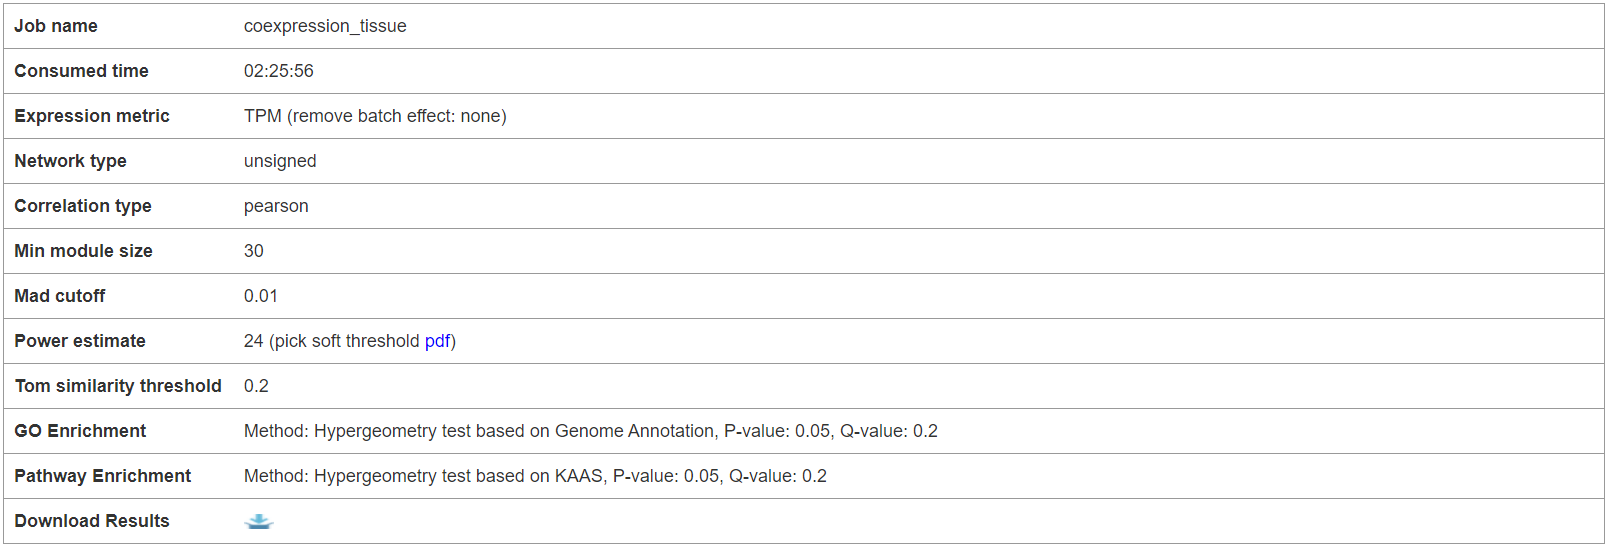
5.3.1 Parameter setting
The first section shows the parameters set by users when submit an analysis task. The analysis result files can be downloaded here.
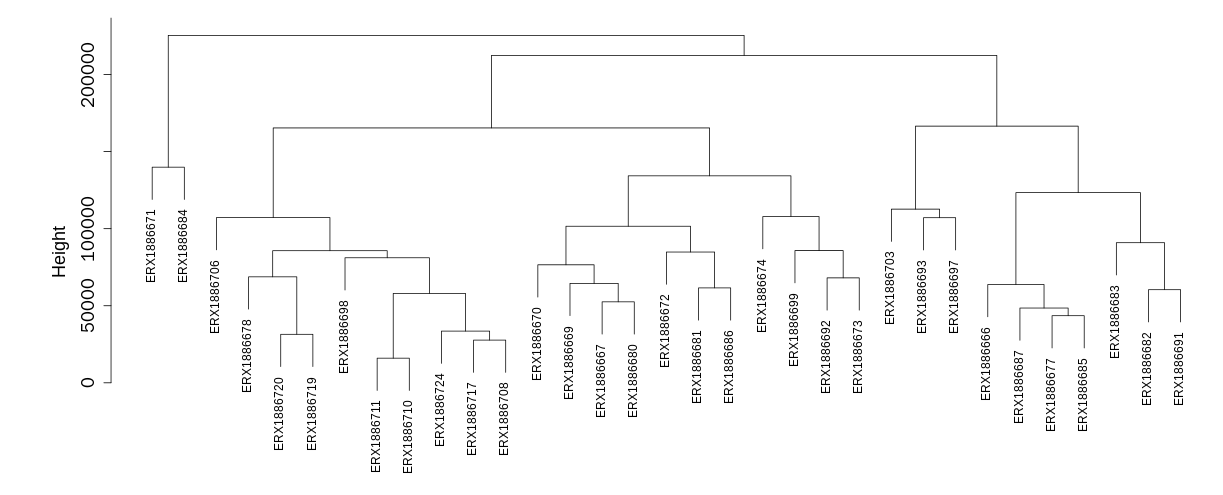
5.3.2 Sample cluster based on expression profiles
This section include a cluster tree based on gene expression through which users can rapidly learn relationships among the selected samples.
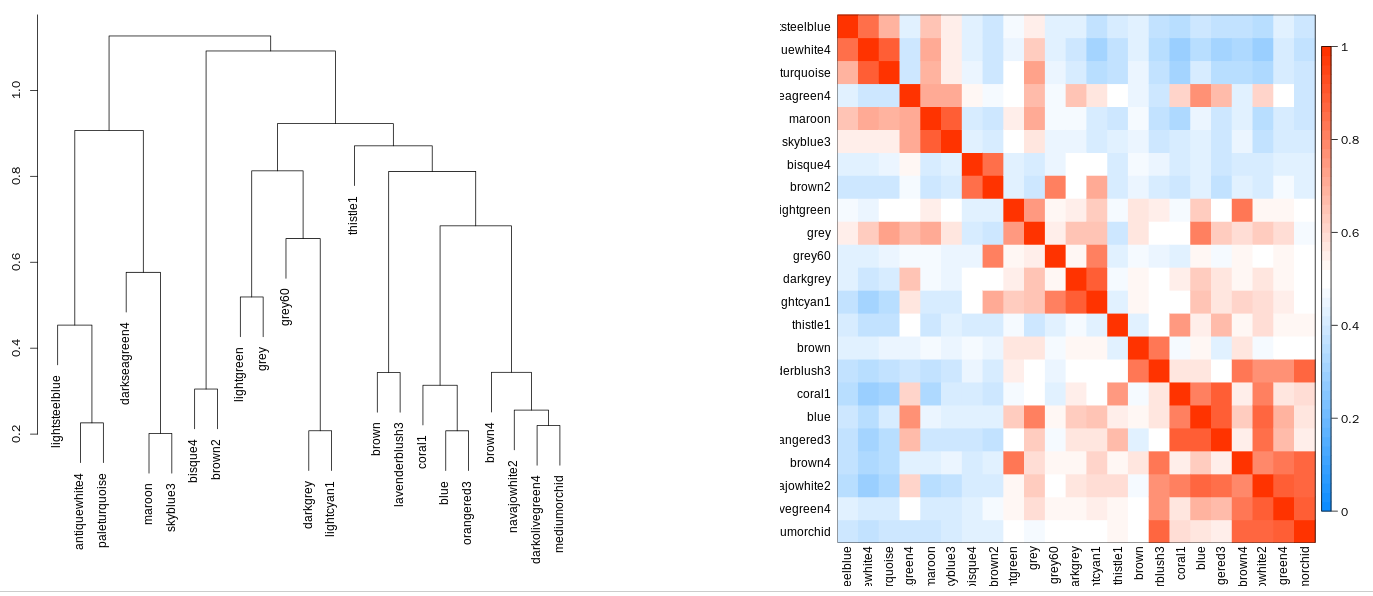
5.3.3 Module cluster
There are two graphics including a tree and a heatmap showing the cluster relationship of the identified gene modules.
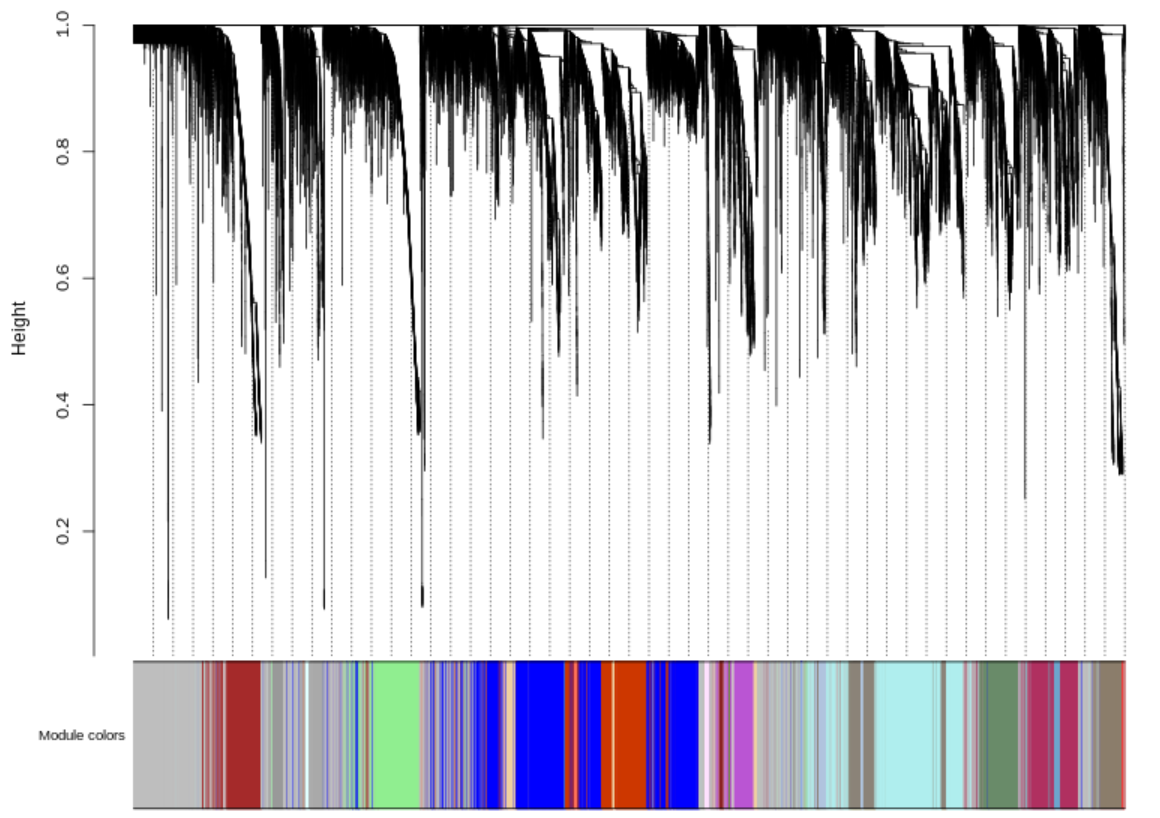
5.3.4 Module gene cluster
There is a gene dendrogram and corresponding module colors to refect cluster relationships among module genes.
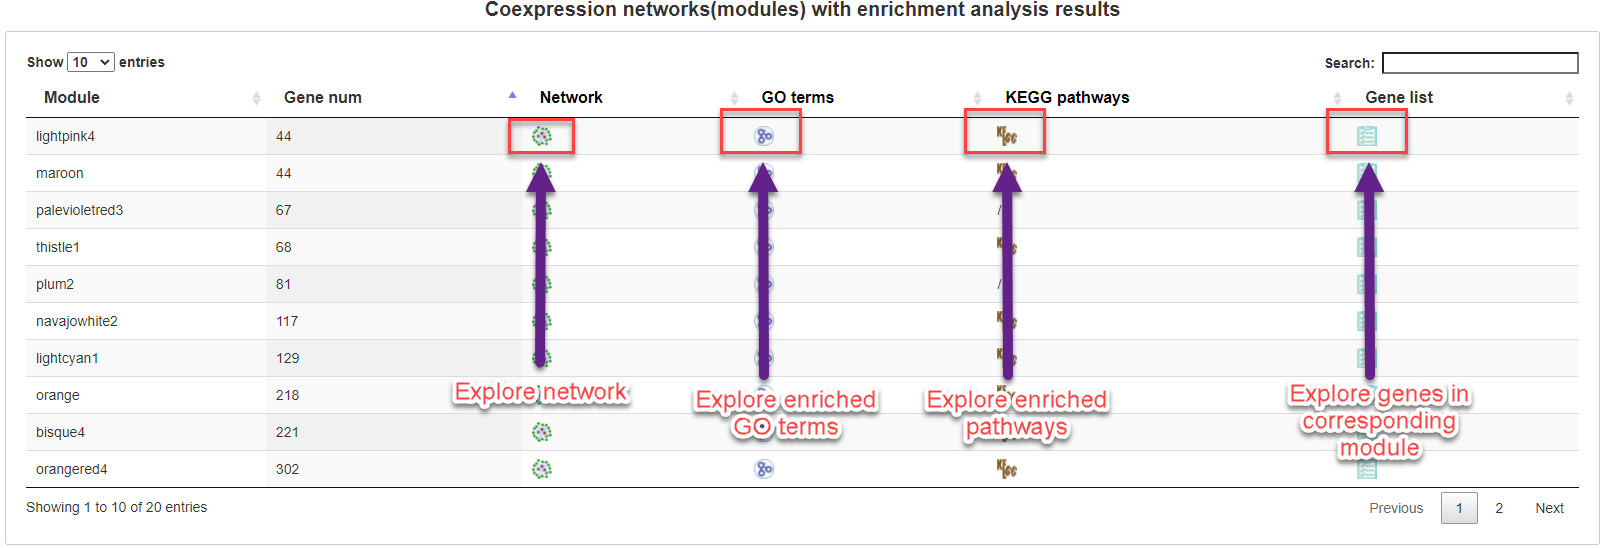
5.3.5 Module list
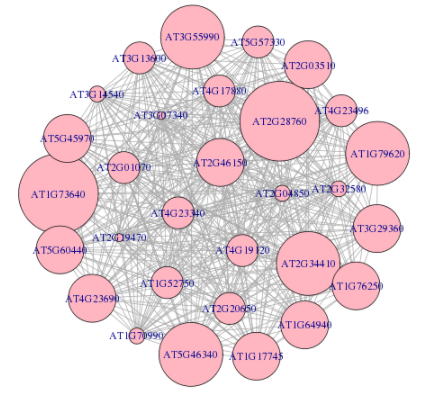
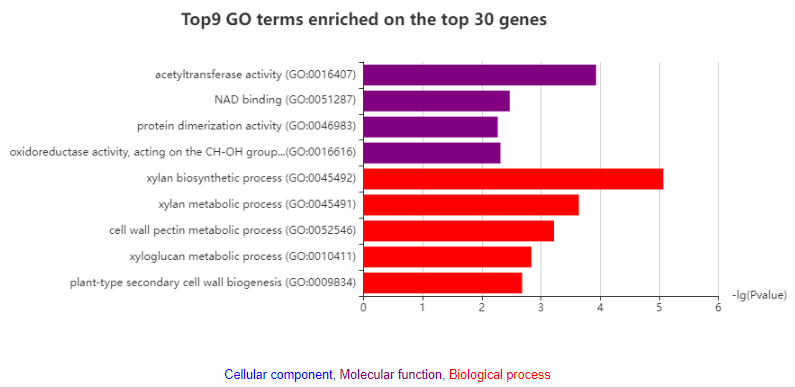
All identified coexpression modules are listed in a table with links to show coexpression network, enriched GO terms, enriched pathways and genes in corresponding module.
Although there are more than 30 genes in a module, only the top 30 genes are used to construct network. In network, nodes indicate module genes. Node size represents the connectivity with the other inner genes or module member-ships. The larger node, the more important in the network. The largest node represents the hub gene. To summarize the function of module, GO and KEGG pathways enrichment analyses are also performed on all genes and top 30 genes, respectively.
Click on the links in gene table, users can obtain gene expression levels in samples and relative annotation information.
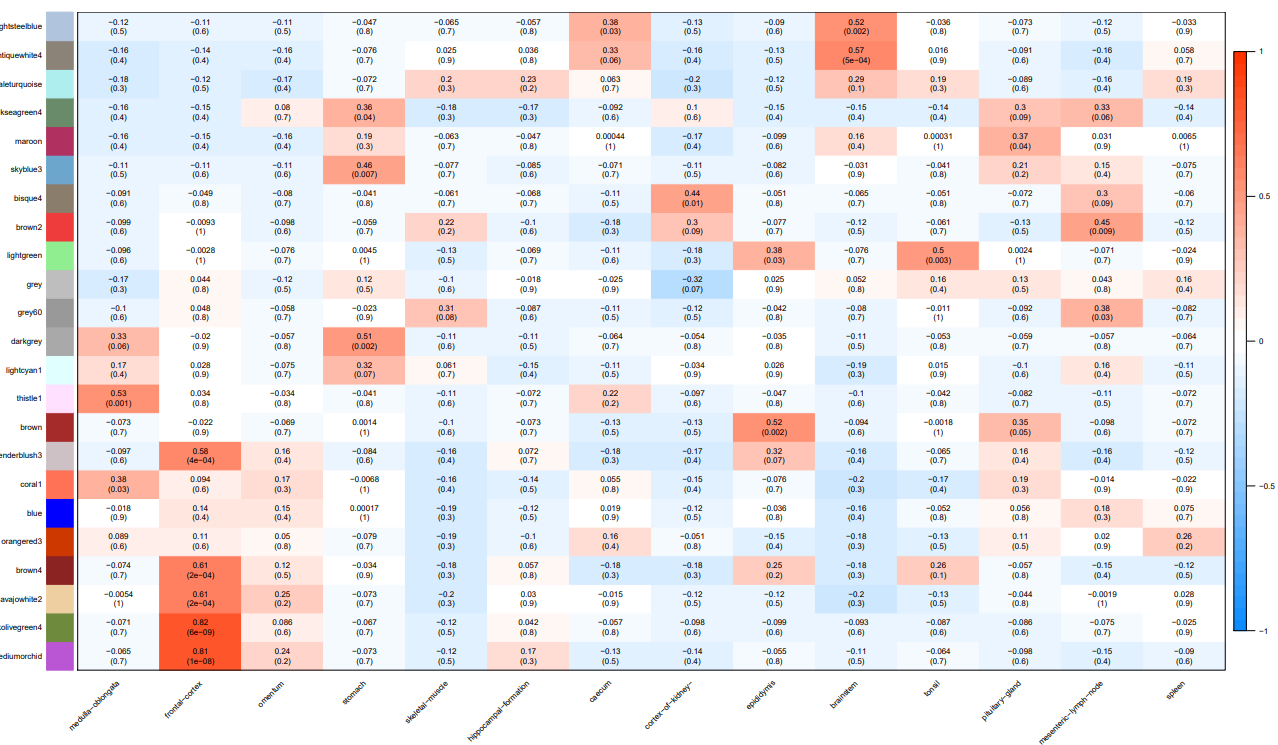
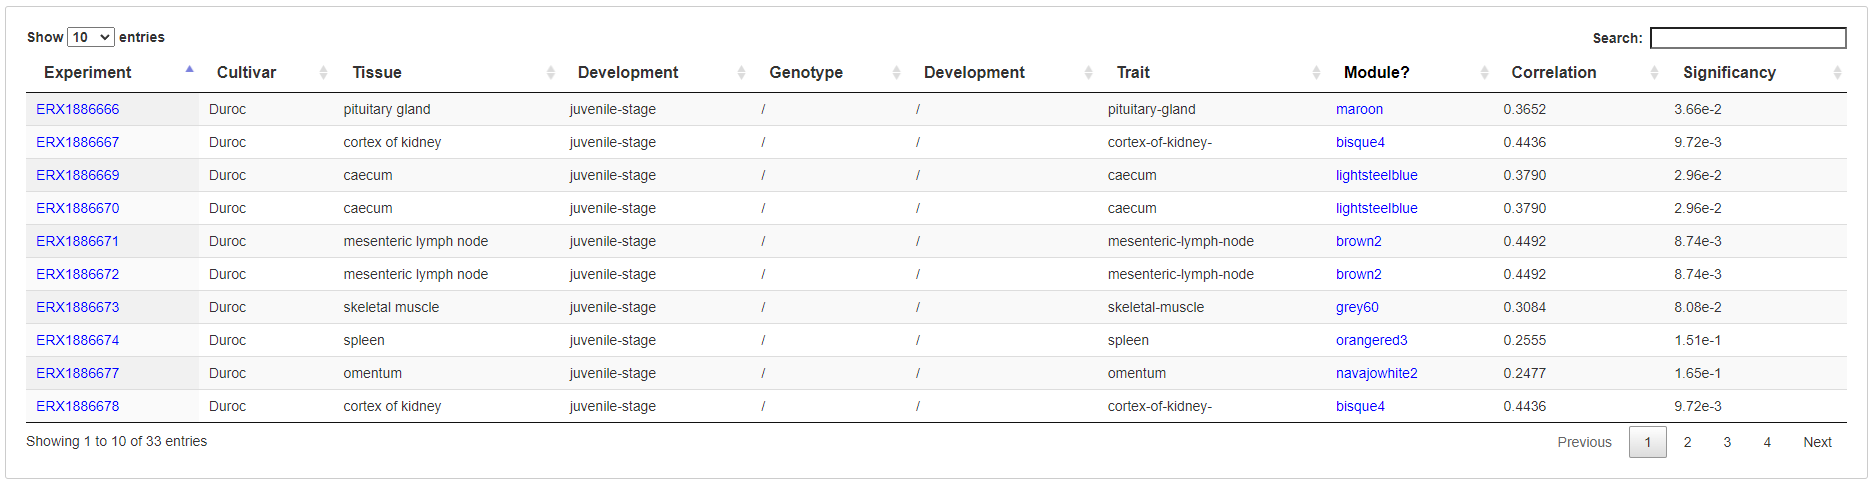
5.3.6 Relationship between modules and traits
A heatmap is used to show relationship between modules and traits.
Moreover, a table is used to list traits or samples corresponding to the most related module.